
Transform Your Codebase to Intuitive Diagrams in a Few Seconds
System architecture, sequence diagrams, ERD diagrams

Diagrams make it easy to understand a complex code base.
However, no one likes drawing diagrams for code bases. It is one of those documentation tasks that keeps getting delayed because no one wants to bother with it.
But what if I told you that there’s a new AI Agent that can make this task extremely easy?
Last week, I got to try the beta version of Eraserbot and it blew my mind.
Eraserbot is an AI agent that can generate diagrams (system architecture, sequence diagrams, ERDs, cloud architecture, etc) straight from your codebase. It can also automatically keep these diagrams updated as and when your codebase changes.
I tried Eraserbot on a bunch of different types of code-bases and the results were amazing. In this post, I share my findings and thoughts about the same.
Making Codebase Diagram a Breeze
The first feature I tried was around codebase diagrams.
Codebase diagrams (in Eraserbot’s approach) are diagrams generated from a Git repository. By providing a prompt, Eraserbot scans relevant files from the repository to create the requested diagram, helping teams quickly understand architecture, infrastructure, schemas, and application logic.
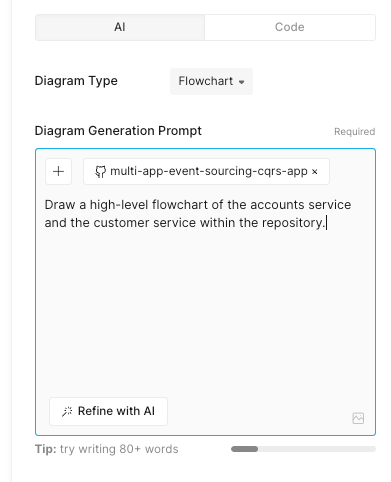
For example, let’s say I built a Java Spring Boot application that consisted of two main services: Accounts Service and Customer Service.
Next, I connected my GitHub repo to Eraser and asked Eraserbot to generate a diagram for this repository. Here’s the exact prompt I used after selecting Diagram Type as “Flowchart”:
“Draw a high-level flowchart of the accounts, service, and the customer service within the repository”.
After clicking the Generate button, I went to prepare a coffee for myself. And by the time I returned to my desk, a beautifully labelled diagram with all the required details was waiting for me.
Here’s what it looked like:

Pretty sweet? Isn’t it.
And if you are wondering, flowcharts aren’t the only type of diagram Eraserbot can help with.
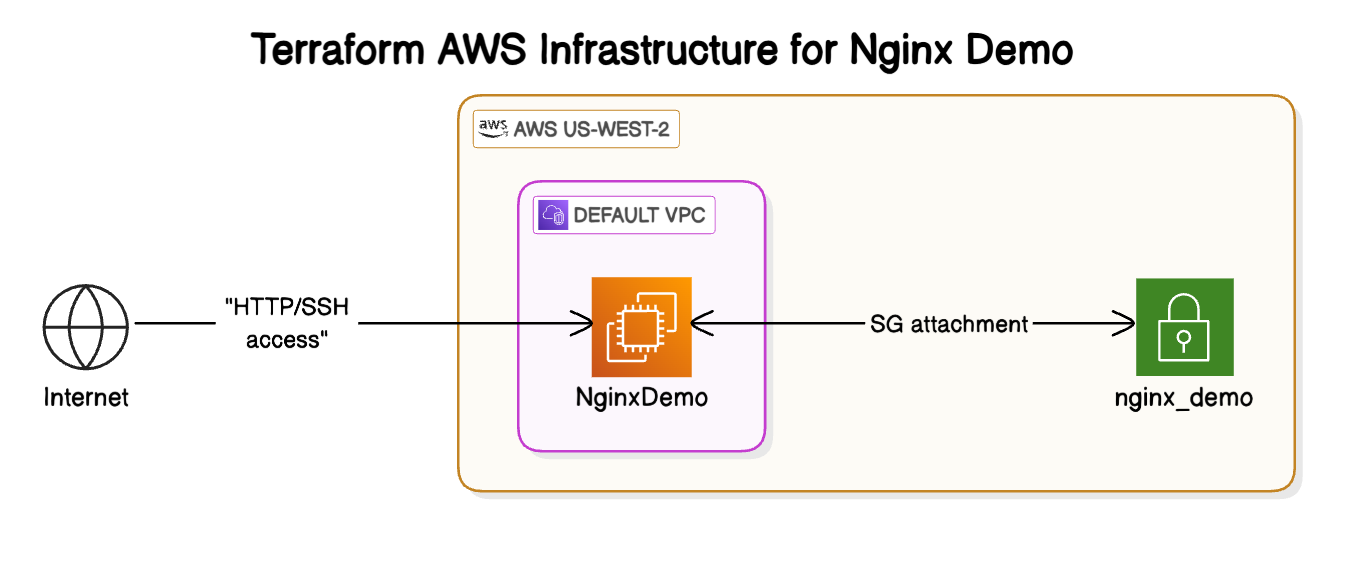
You can also use Eraserbot to generate cloud architecture diagrams. For example, I wrote a Terraform configuration to deploy an Nginx server on an AWS EC2 instance. Once I had written the configuration, I asked Eraserbot to generate a cloud architecture diagram for this setup using the simple prompt:
“Draw a cloud architecture diagram using .tf files in the repo”

And here’s what I got:
Analyzing Open Source Code-Bases
Another wonderful use-case I found for Eraserbot is around analyzing open-source code bases to get a better picture of what’s going on under the hood.
For example, I tried to use Eraserbot to make sense of Prisma’s migration process. Here’s the prompt I used to build a sequence diagram using Prisma’s GitHub repo:
Visualize how migrations are applied
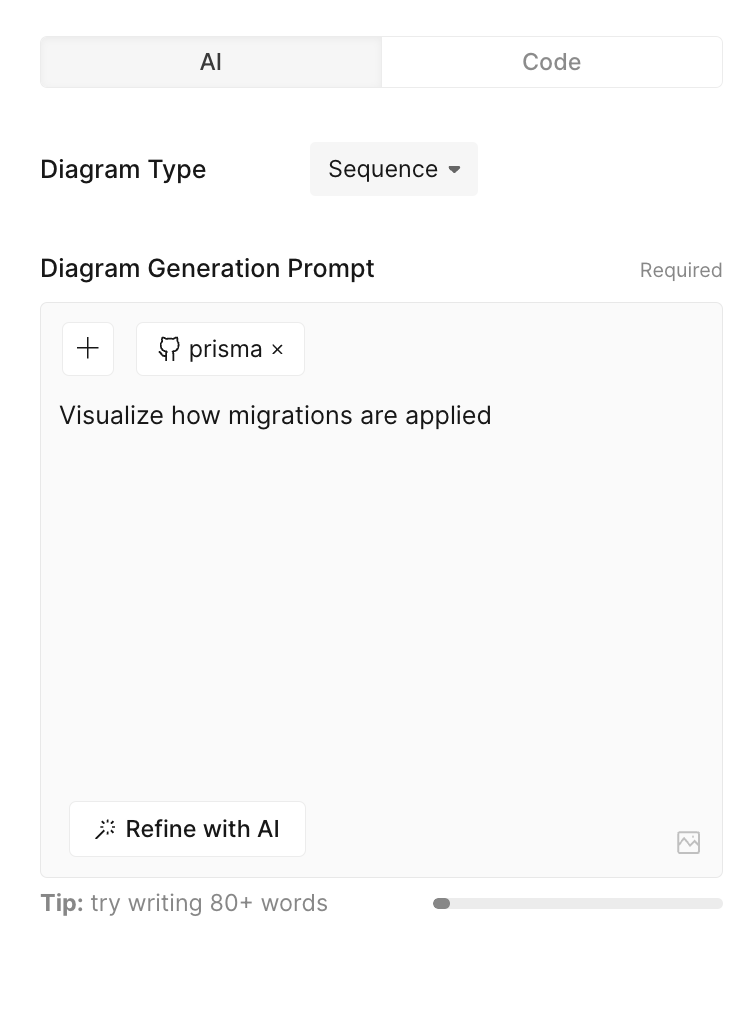
And this was the output:

Looks pretty awesome if you ask me. And of course, one can always iterate upon the initial result to make the diagrams more refined.
Keeping the Diagrams Up-to-Date
Now, you might be wondering that generating new diagrams for a particular state of the application or the architecture is all fine. But what happens when there is a change to the application?
The biggest pain point in maintaining documentation and diagrams such as this is keeping them updated over time. Each time, there’s a change to the application and the diagram isn’t updated, there’s a deviation between the documented state and the actual state of the application. Over time, the deviation keeps increasing and eventually gets so big that it becomes virtually impossible to fix it. The documentation and the diagrams become a sort of technical debt.
Ultimately, the team ends up creating a new diagram and spending extra effort. And then, the same cycle repeats.
Eraserbot solves this problem as well.
It provides a feature called “Monitor” that keeps the diagrams updated even as your codebase evolves with time. Here’s what the official page says:

This is how you can set up a Monitor linked to a specific GitHub repository. You provide a name to the Monitor to keep track of it later, select a Monitor Type, choose a specific repository, and write your prompt that tells Eraserbot what kind of diagram to create.
I tried it for one of my repositories that implemented an Event Sourcing application using Spring Boot and Axon framework.

After clicking “Generate Diagram”, Eraserbot created this amazing diagram for me in a just a few seconds.

This can be then saved as a Monitor to keep the diagram updated over time, and as you can see, it keeps track of all the necessary files.

My Views About Eraserbot
Overall, I feel that Eraserbot is a wonderful addition to Eraser’s already amazing set of features.
The start is so great and judging by the pace at which new features are shipped, Eraserbot is only going to improve in terms of accuracy and scope.
A few great use-cases I can already imagine for Eraserbot are as follows:
Eraserbot automatically generates and updates diagrams whenever your code changes. Just sync it with your GitHub repo, and boom—your documentation stays 100% accurate. This is a big win in my view.
Eraserbot gives you before-and-after diagrams, potentially making code reviews super clear and efficient.
Makes it fun to explore how open-source libraries work in a visual manner.
It facilitates efficient pull request (PR) reviews by providing clear, before-and-after visualizations of code changes.
With Eraserbot, you can maintain audit-ready architecture diagrams without spending sleepless nights just before an upcoming audit.
No need to avoid the task of creating codebase diagrams.
You can give Eraserbot a try here:
Also, special thanks to the Eraser team for sharing the details about Eraserbot and collaborating on this post.
So - what do you think about Eraserbot and its features?
That’s it for today! ☀️
Enjoyed this issue of the newsletter?
Share with your friends and colleagues.
This looks pretty impressive. I'll definitely take a deep dive into it.
Thanks for sharing, Saurabh.