
Eraser’s New AI-Driven Diagramming Workflow
Making Documentation Wonderful Again

If there is one universal truth in software engineering, it is that everyone loves having documentation, but absolutely nobody loves writing it. We’ve all been there: you’ve just finished architecting a complex system or debugging a nasty race condition, and now you have to open a blank canvas, drag 50 rectangles onto a screen, and manually draw arrows until your eyes glaze over.
Eraser, the developer-focused whiteboard tool, makes this extremely easy, and now it can do a lot more with new integrations. The premise of this new integration is amazing: instead of dragging and dropping UI elements, what if you could just tell your IDE to “draw the architecture diagram”?
Last week, I got to try the new AI integrations of Eraser and here’s what I learned:
The Setup
The biggest friction point in documentation is context switching. You usually have to leave your code editor, open a browser, log in to a tool, and start from scratch. However, Eraser makes this easy. All you need is install the skill in your IDE of choice by running a simple CLI command.
npx skills-add eraser-labs/eraser-io
With this command, we are essentially priming the IDE to work with Eraser. This allows the user to stay within an AI-powered editor (like Cursor) and generate diagrams without leaving their code.
How It Works
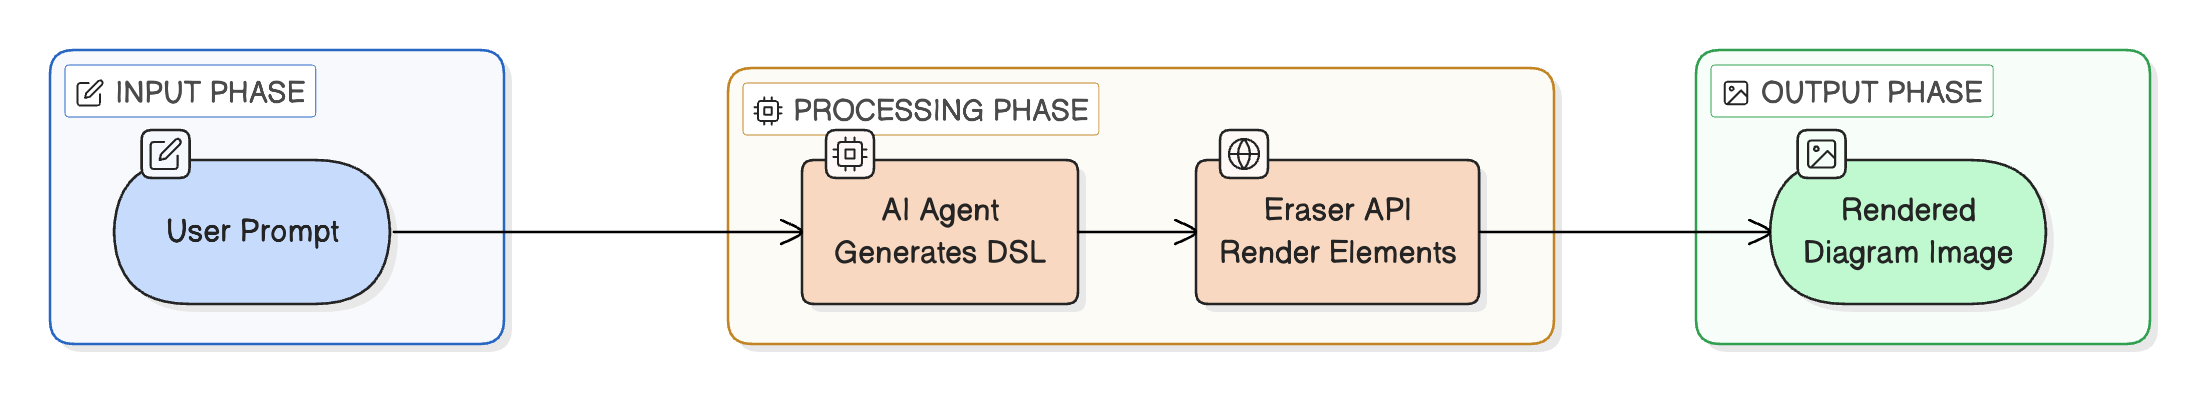
When we ask the AI agent to create a diagram using the Eraser skills, here’s what happens behind the scenes:
You describe the diagram you want in natural language
The AI agent processes your request:
Skills: The agent generates Eraser-specific syntax.
MCP Server: Can use the syntax or generate with natural language
Eraser returns a rendered diagram image link.
The diagram below shows this flow:
The agent can now generate any diagram type supported by Eraser:
Architecture diagrams - Cloud infrastructure, system design
Sequence diagrams - API flows, authentication sequences
Flowcharts - Process flows, decision trees
Entity relationship diagrams (ERD) - Database schemas
BPMN diagrams - Business processes, swimlane diagrams
Trial 1: Generating OAuth Flow
To truly test a diagramming tool, you need a subject that is notoriously annoying to visualize. And therefore, I tried to visualize the OAuth flow:
If you have ever had to explain the OAuth flow to a junior developer or a stakeholder, you know the struggle. You have the User, the Client App, the Authorization Server, and the Resource Server. Then you add in the PKCE (Proof Key for Code Exchange) flow, and suddenly everything can start looking like a mess.
So, I tried it with Eraser this time, using a simple prompt. Instead of drawing the “Client” box, you simply prompt the agent: “Generate a sequence diagram for the Google OAuth2 flow using PKCE and OIDC discovery.”
Here’s what I got in just a few seconds:
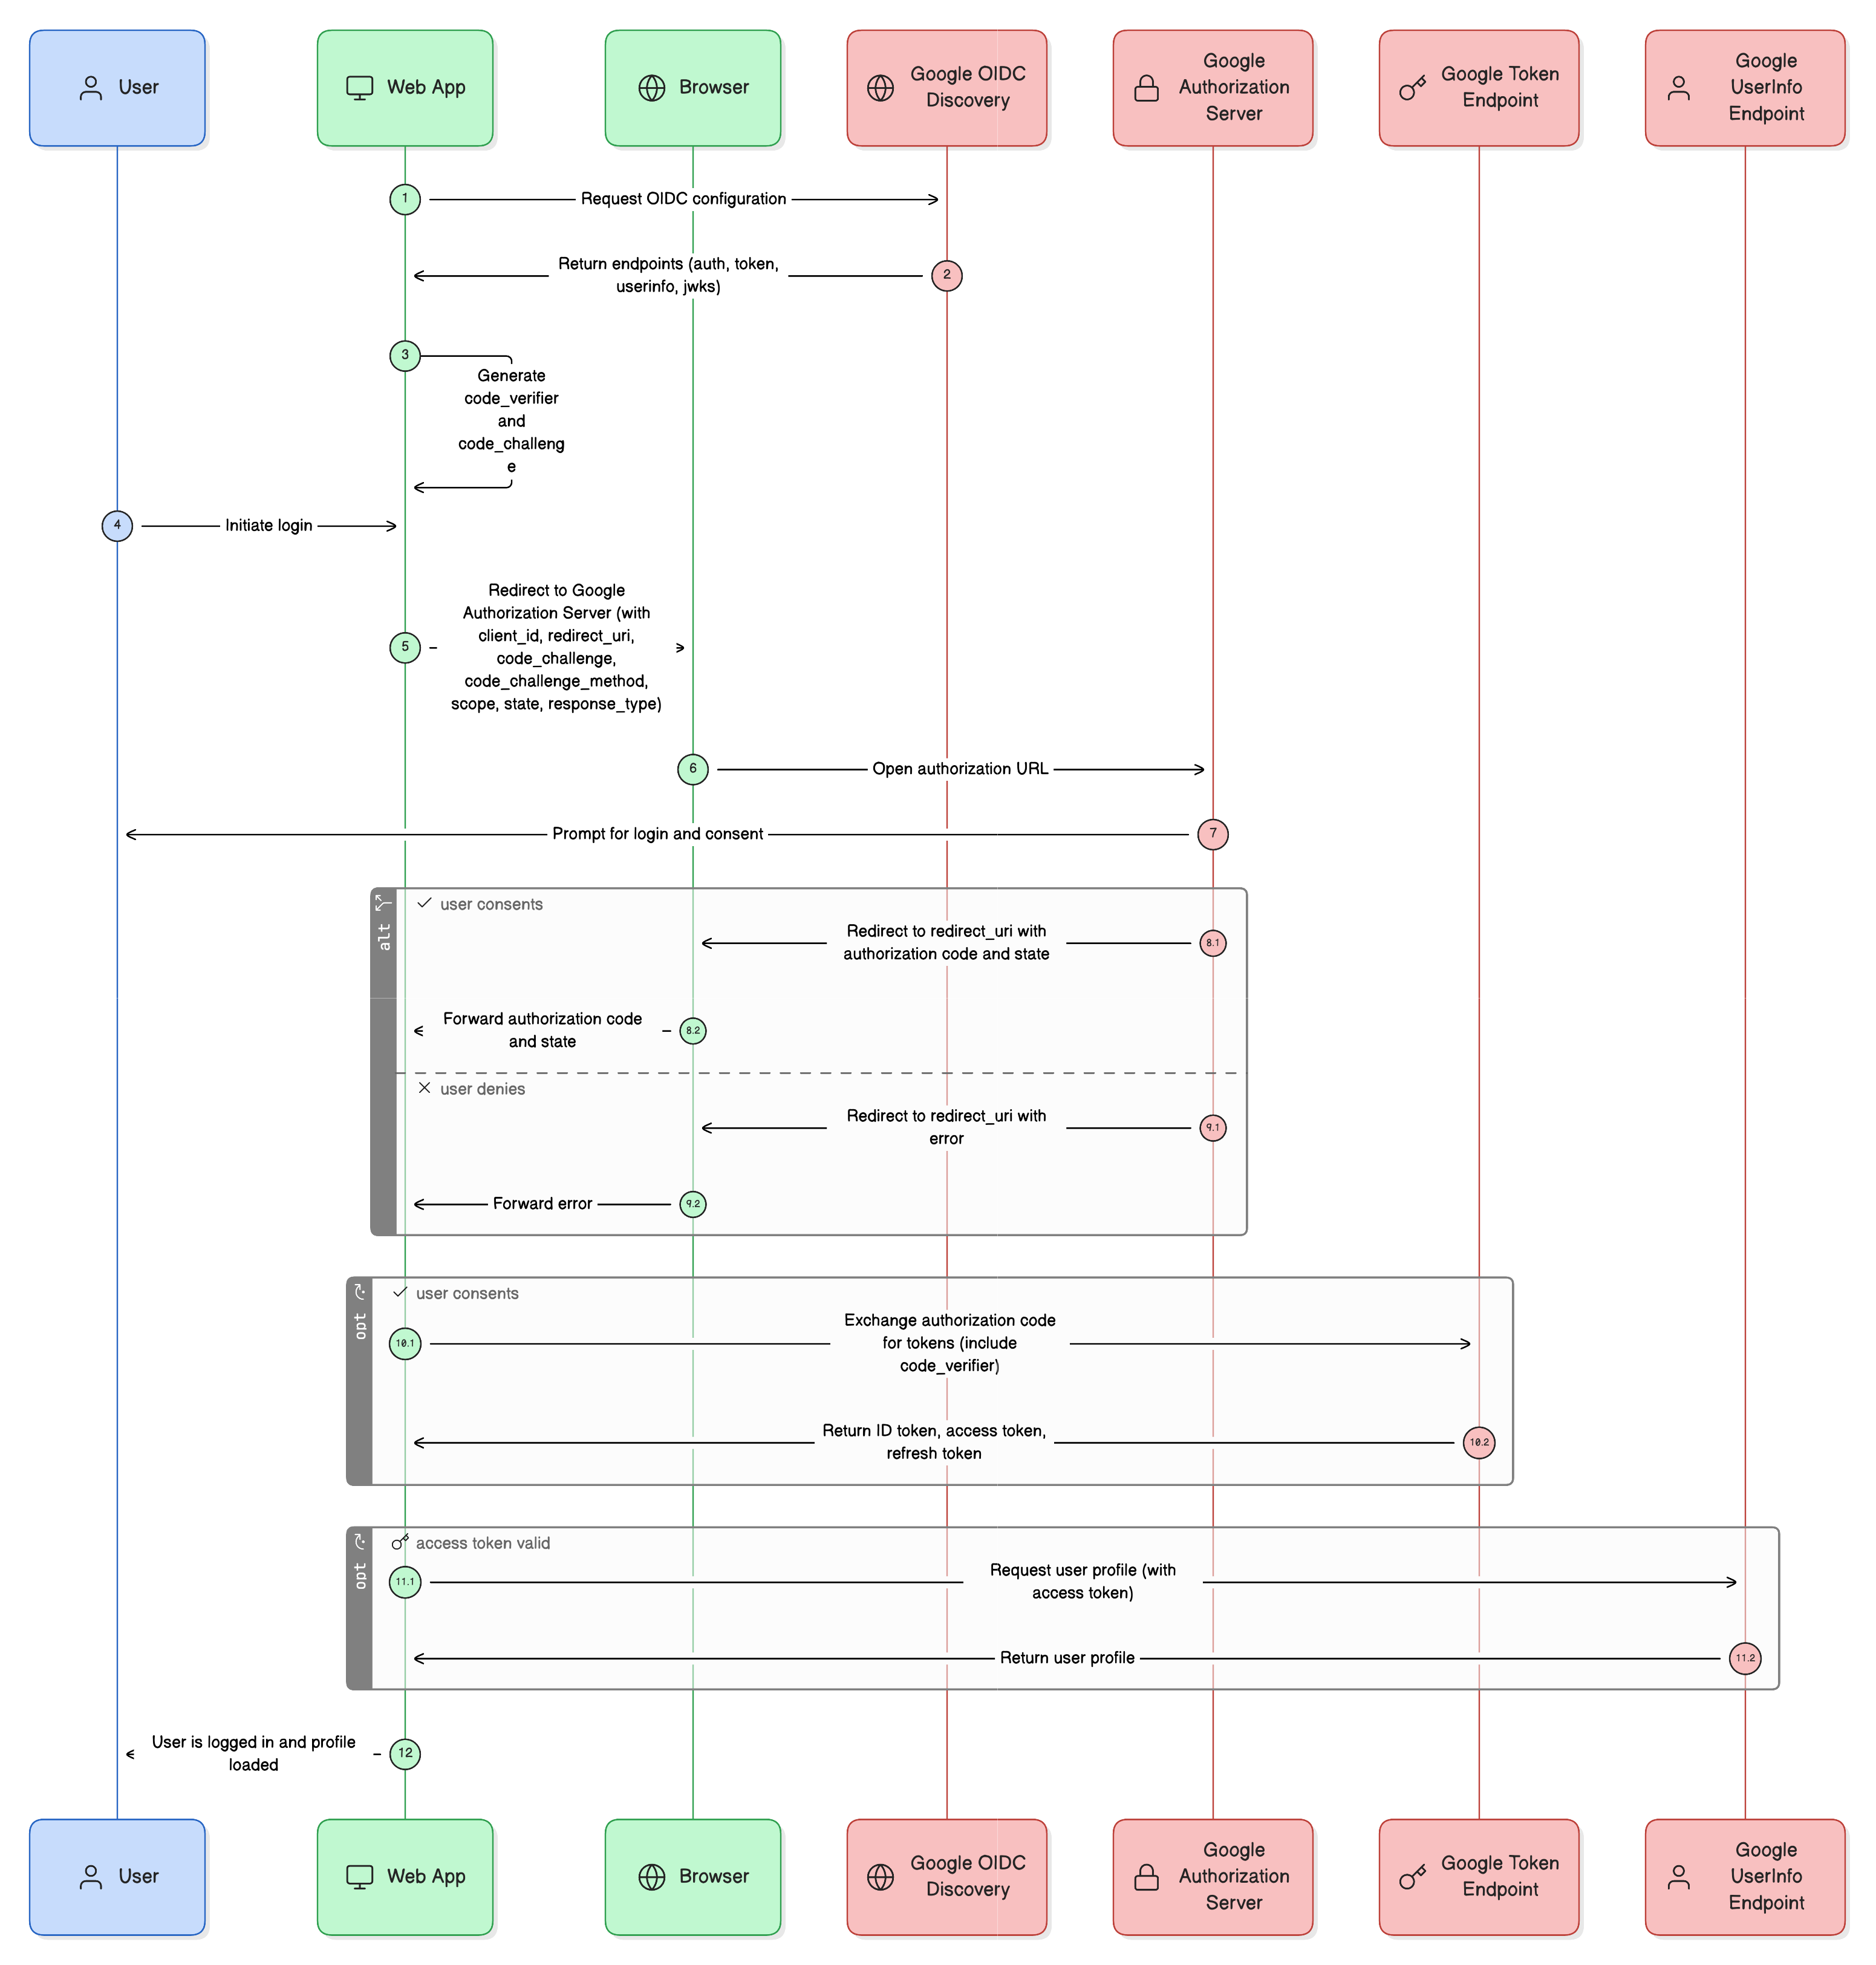
Pretty amazing, if you ask me. And it also makes thing easy to build upon further if needed.
Trial 2: Visualizing Infrastructure (The Terraform Scenario)
Another trial I did was using the infrastructure diagrams that you can generate using Terraform files.
Imagine you join a new team and are handed a massive repository of Terraform files. You see a main.tf, variables.tf, and modules for VPCs, RDS instances, and EC2 auto-scaling groups. Reading the code tells you what is there, but it doesn’t tell you how it connects.
Using this AI integration, you could theoretically feed the agent your main.tf file and ask: “Read this Terraform configuration and generate an architecture diagram showing the relationship between the public subnets, the load balancers, and the database.”
The AI parses the HCL (HashiCorp Configuration Language), identifies the resources, understands the depends_on or reference links, and outputs a visual map.
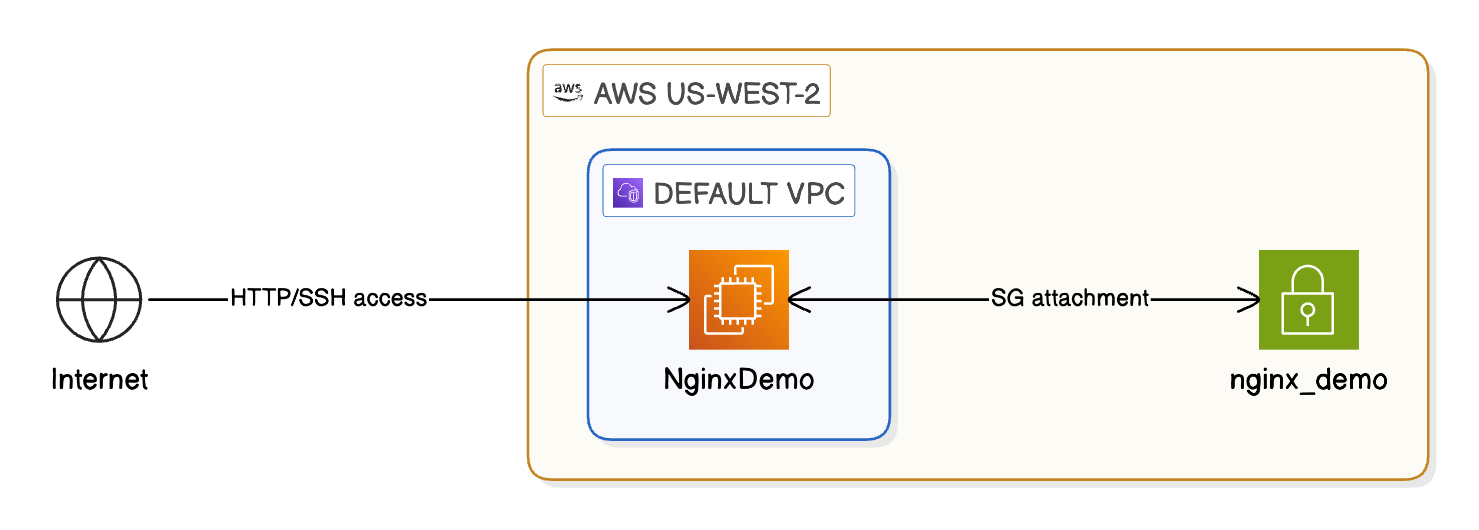
This “Reverse Engineering” capability of Eraser is perhaps the strongest selling point for me. It transforms “documentation” from a proactive chore (something you have to create) into a reactive asset (something you can generate instantly from existing code).
What I Feel About The AI Integrations?
After seeing the capabilities, here is what I think about this skill and where it fits in a developer’s toolkit.
1. It Respects Flow State: The primary benefit isn’t just that the computer draws faster than you. It’s that you don’t have to stop coding to document. By keeping the generation inside the terminal/IDE, there is very little context switching. You stay in the terminal, you stay in the code, and the diagram happens in the background.
2. The “80/20” Rule of Diagramming: Is the AI-generated diagram perfect? Probably not 100% of the time. It might mislabel a specific edge case or group things awkwardly. However, it gets you 80% to 90% of the way there in seconds. It is much easier, in my view, to move a few pre-generated boxes around than to create a system design from a blank white screen.
3. Documentation as a Communication Tool: Often, backend developers build complex architectures that the Ops team has to deploy. Miscommunication here is common. Being able to instantly generate a visual representation of your code or Docker files bridges that gap.
Also, special thanks to the Eraser team for sharing the details about the new AI integrations and collaborating on this post.
You can try out these integrations yourself. Here’s the link to the documentation that can guide you through the process:
So, what do you think about these features?
That’s it for today! ☀️
Enjoyed this issue of the newsletter?
Share with your friends and colleagues.
Thanks, Saurabh. This will help me not only in the coding aspects of it, but also in networking-type diagrams if it supports them now or later.
Wow looks damn clean. Will try this out today.